| Back Take Quiz Next Prev | |||||||||
Weather Charts
Surface Analysis Chart Surface Analysis charts vary in format depending on the provider. In general they show fronts, pressure centers, and isobars. They may or may not show dew point, wind, weather, and obstructions to vision. The test does not refer to any specific surface analysis charts, but may ask general questions about them. Weather Depiction Chart 
Low-Level Significant Weather Prognostic Chart Coverage of the old four-panel prognostic charts was dropped in June, 2017. Low-Level Prognostic charts are now comprised of two panels. The panel on the left provides forecast conditions for 12 hours from the valid time. The panel on the right provides forecast conditions for 24 hours from the valid time.  High-Level Significant Weather Prognostic Chart These forecast charts encompass the atmosphere from FL 250 to FL 630. ISOL = isolated; less than 1/8 coverage OCNL = occasional; 1/8 to 4/8 coverage FRQ = frequent; 5/8 to 8/8 coverage  Graphical Forecasts for Aviation (GFA) These are more newly designed charts, interactively delivered online . They are highly configurable and filterable by the user. The two chart plots used in the question figures come from a subset of the GFA charts referred to as the "Aviation Surface Forecast" and "Aviation Clouds Forecast". These are considered "static" charts and are not as interactive as the full GFA charts. Here is the link to the GFA static plots: https://www.aviationweather.gov/gfa/plot 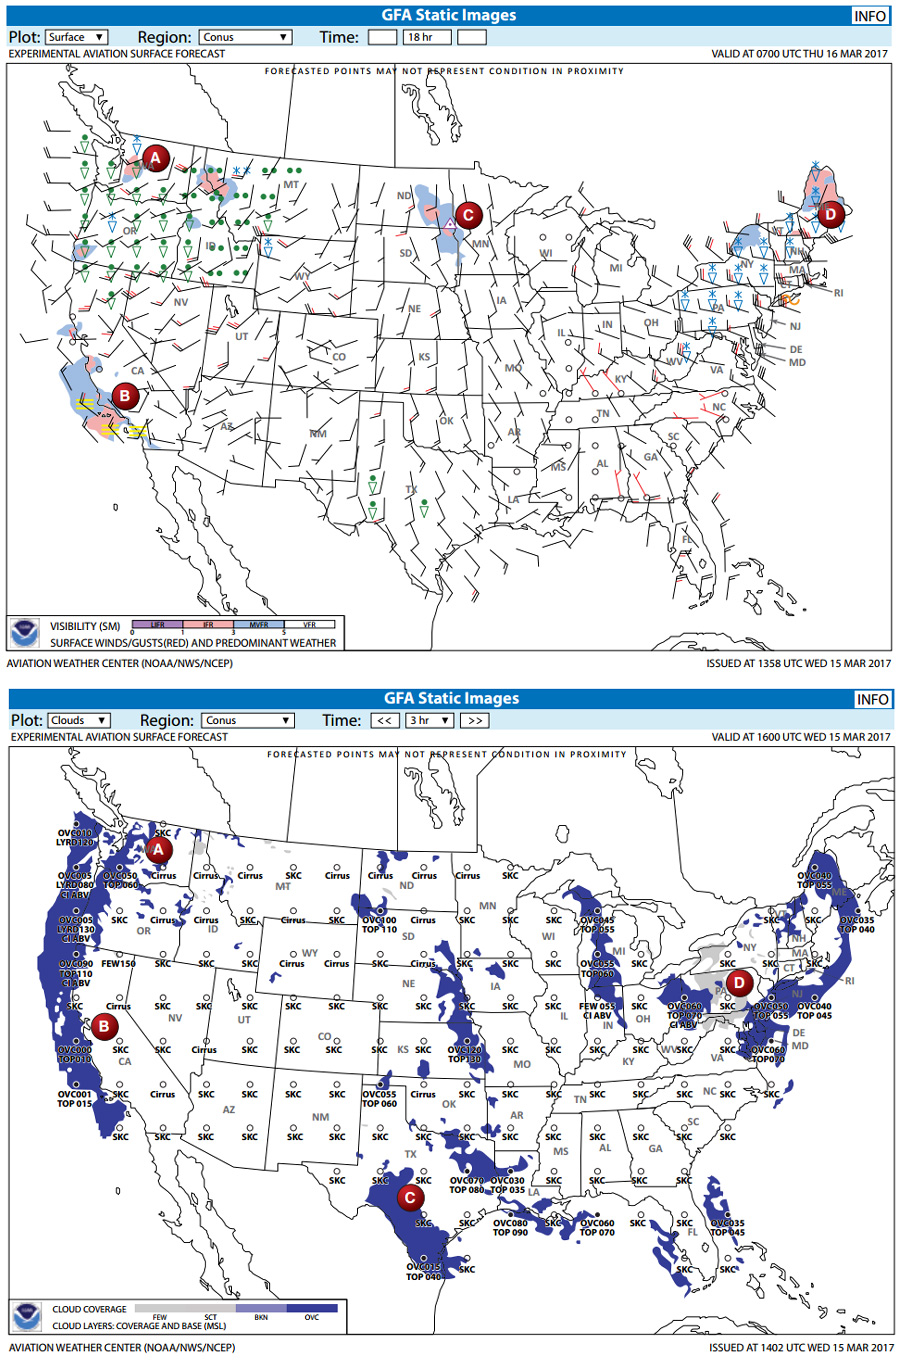  Winds and Temperatures Aloft If the wind speed is forecast to be from 100 to 199 knots, the forecaster will add 50 to the wind direction and subtract 100 from the wind speed. To decode, you must subtract 50 from the wind direction and add 100 to the wind speed. If the wind speed is forecast to be 200 knots or greater, the wind group is coded at 199 kt. When the forecast speed is less than 5 knots, the 4-digit wind group is "9900" and is read “light and variable.”  Constant Pressure Analysis Chart According to the FAA's Aviation Weather Services (AC 00-45H), "Constant Pressure Charts are being phased out by the NWS in favor of other products." There are some old questions related to these charts and it is unclear at this time if they remain in the current Instrument Pilot Knowledge Test question database. It is recommended that you know at least the following statement: Constant pressure level forecasts are used to provide an overview of weather patterns at specified times and pressure altitudes and are the source for wind and temperature aloft forecasts.
|
|||||||||


